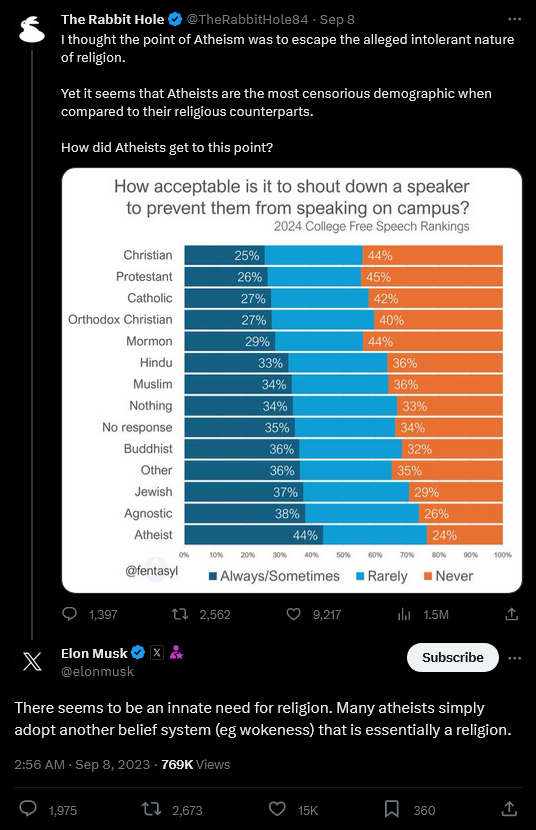
Let’s go a step further and analyze exactly what this graph is saying:
There’s only about a 20% distribution difference in the “never” sections between Christians and atheists. So on average, 4/5 atheists would answer the exact same as Christians. All this graph says is that Christians are barely more tolerant than people who identify as atheist. Barely is the key word. If anything, this graph proves that tolerance levels don’t fluctuate that much for the individual between differing religions.
But Bible thumpers need any win they can get, so they don’t read the data for what it is, they just see one bar longer than the other and declare victory.