

May be worsening? It’s worsening for 50 years now 😬
As in accelerating. Not just continuously getting warmer, but doing so faster and faster.
Which is what it’s been doing for decades
I mean, yes, but if you view the bump in 2015 as some anomaly, then things were actually surprisingly linear, starting in the 70s:
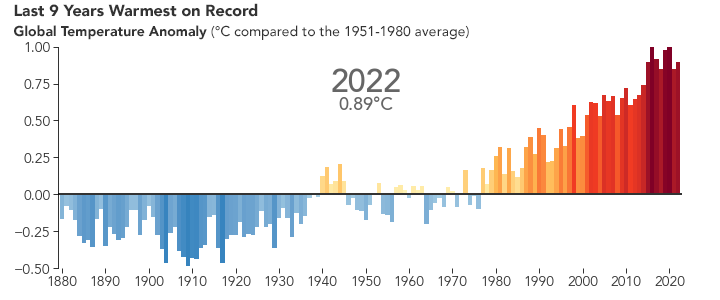
Source: https://earthobservatory.nasa.gov/world-of-change/global-temperatures2023 isn’t on that chart yet, but same organisation, same baseline period, puts it at 1.2°C (Source).
So, not only does it confirm that the 2015 bump was not an anomaly, 2023 is actually an even bigger bump, which just makes it a lot clearer that we are accelerating.Yes. I could see either a line or a curve fitting there, but there’s a lot more bumps than I expected.
Really interesting graph. Thank you.