Basically brute force, I’m not great with it but I was the one on my team responsible for setting up our dashboards. I wrote the prometheus metric collection in our microservices and built the dashboards from that data.
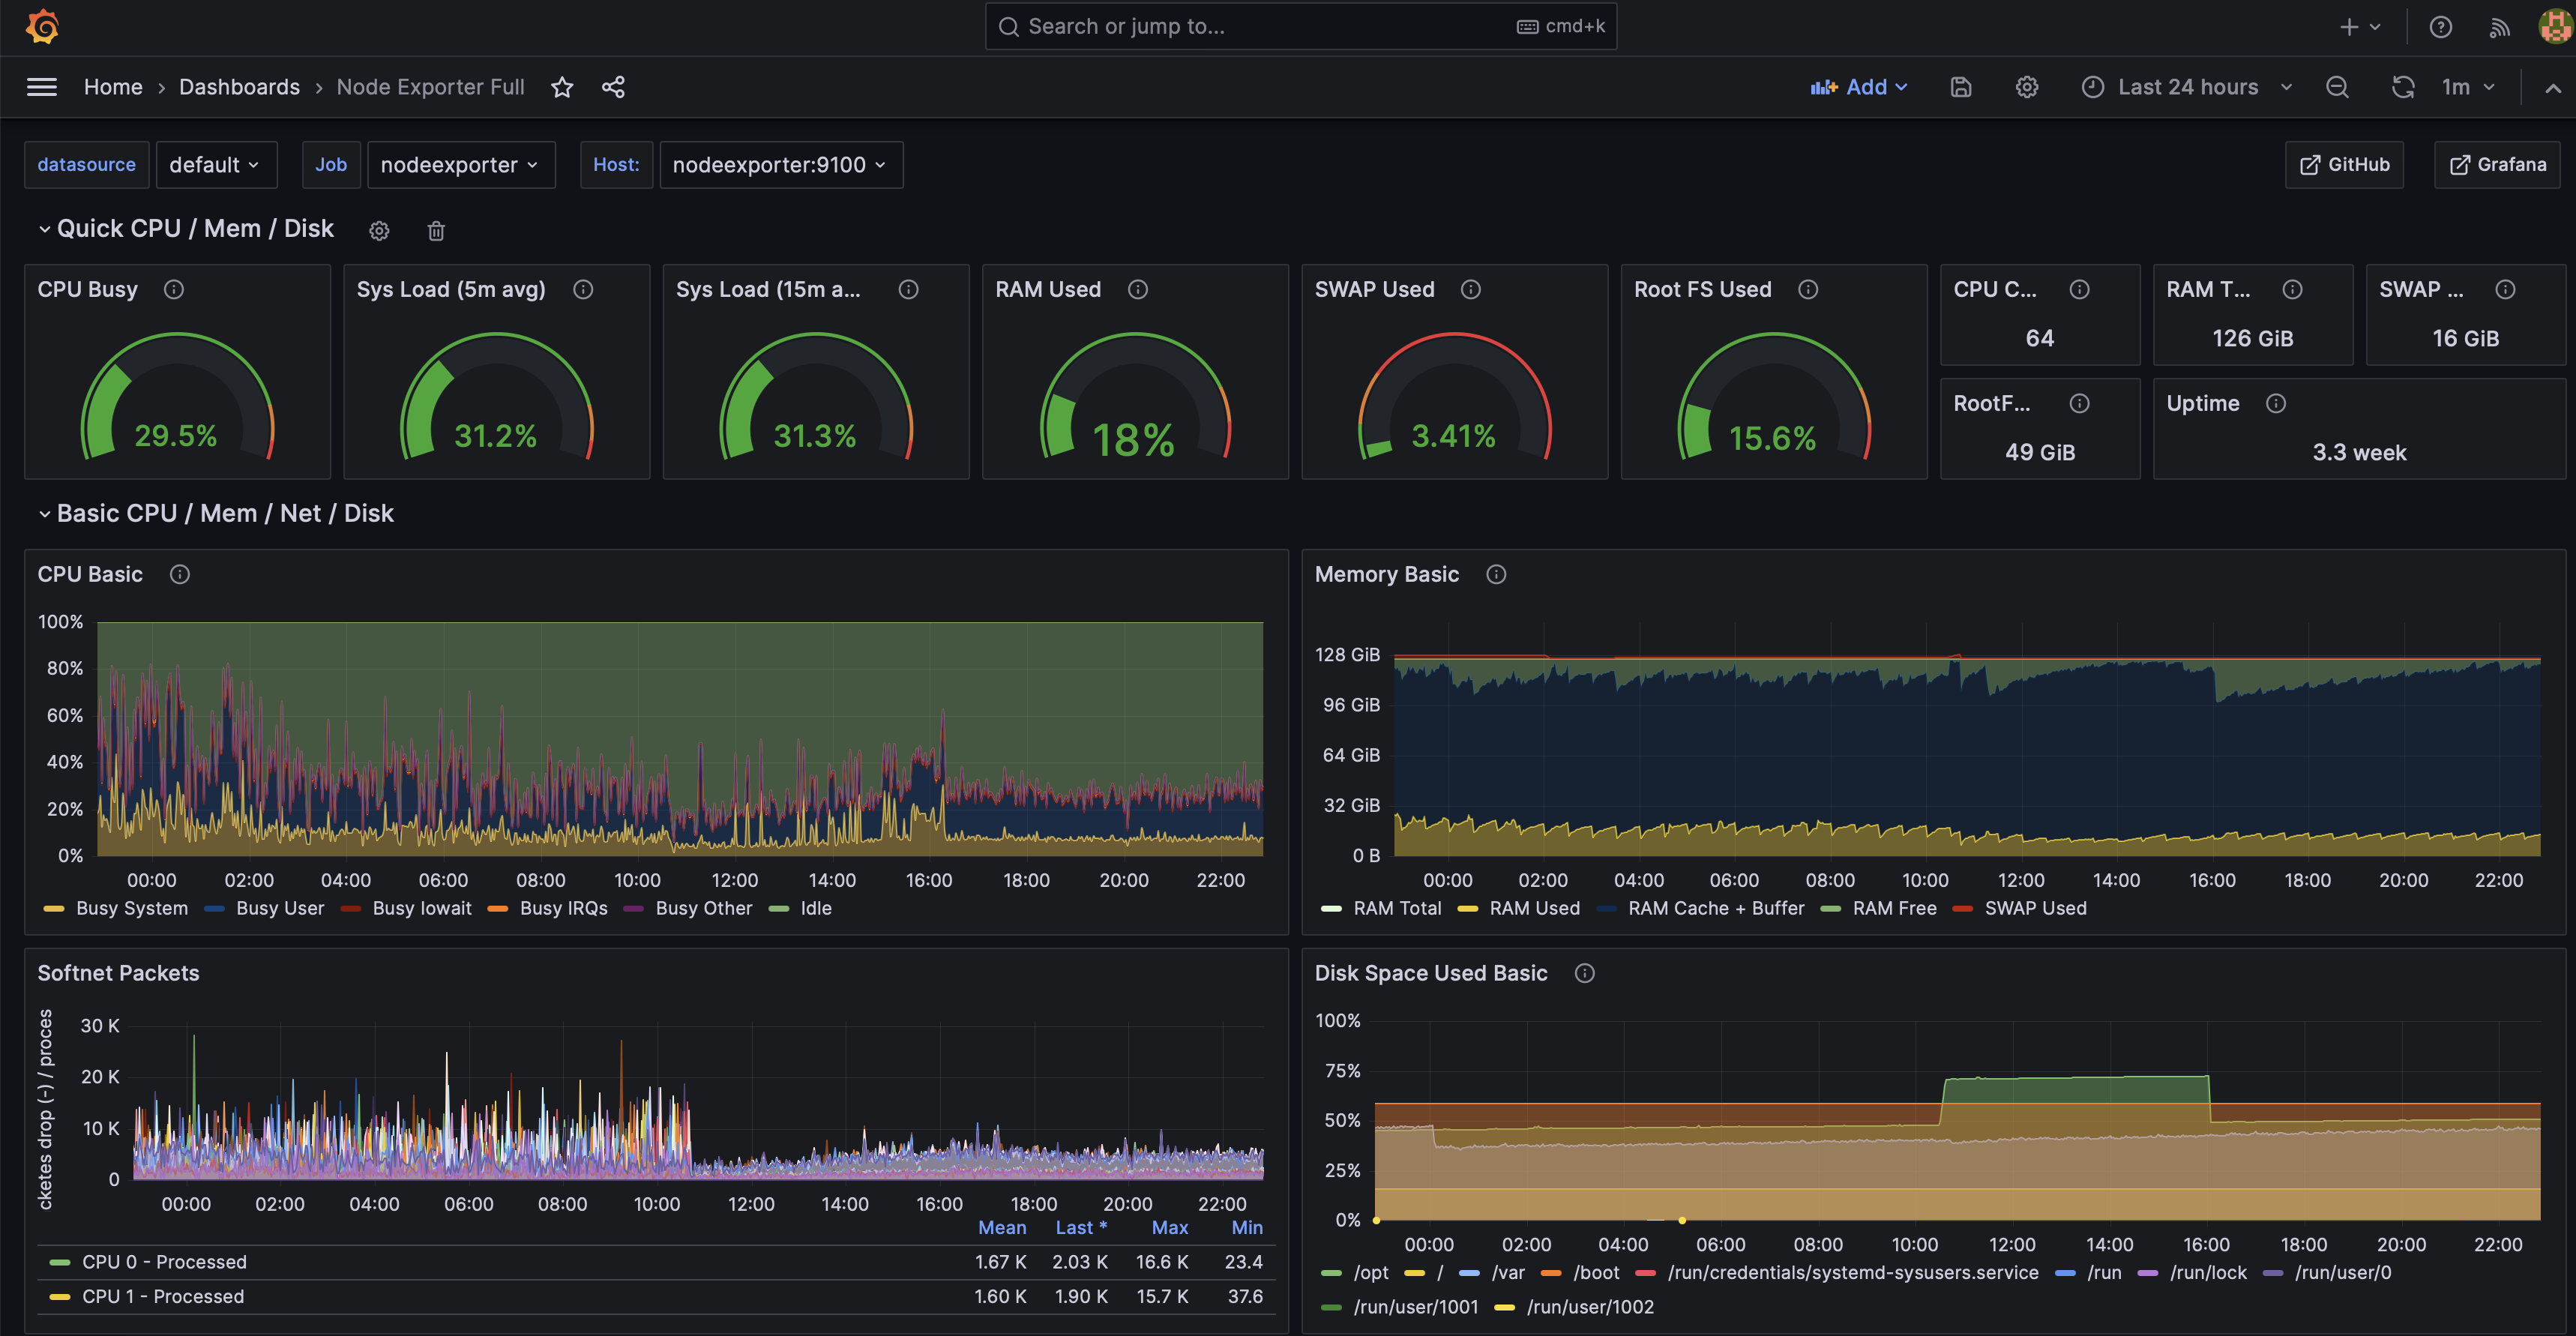
There are tons of free dashboards though for monitoring resources and such so a lot of things I use are just downloaded from the Grafana website. And the docs are good too. So looking at examples + documentation is how I learn. It would be helpful if I was better with math though.


How did you learn it?
Basically brute force, I’m not great with it but I was the one on my team responsible for setting up our dashboards. I wrote the prometheus metric collection in our microservices and built the dashboards from that data.
There are tons of free dashboards though for monitoring resources and such so a lot of things I use are just downloaded from the Grafana website. And the docs are good too. So looking at examples + documentation is how I learn. It would be helpful if I was better with math though.
I guess it’s time to start browsing the dashboards thanks