I hope i don’t make the paper sad by saying this but the numbers are kinda off. (Or i misunderstand)
The only real difference is for below age 24. Then its pretty much the same if not less prevalent for autists.
They point to some other factors about the types of questions that indicate that the differences are underestimated but evidently that didn’t translate in hard numbers.
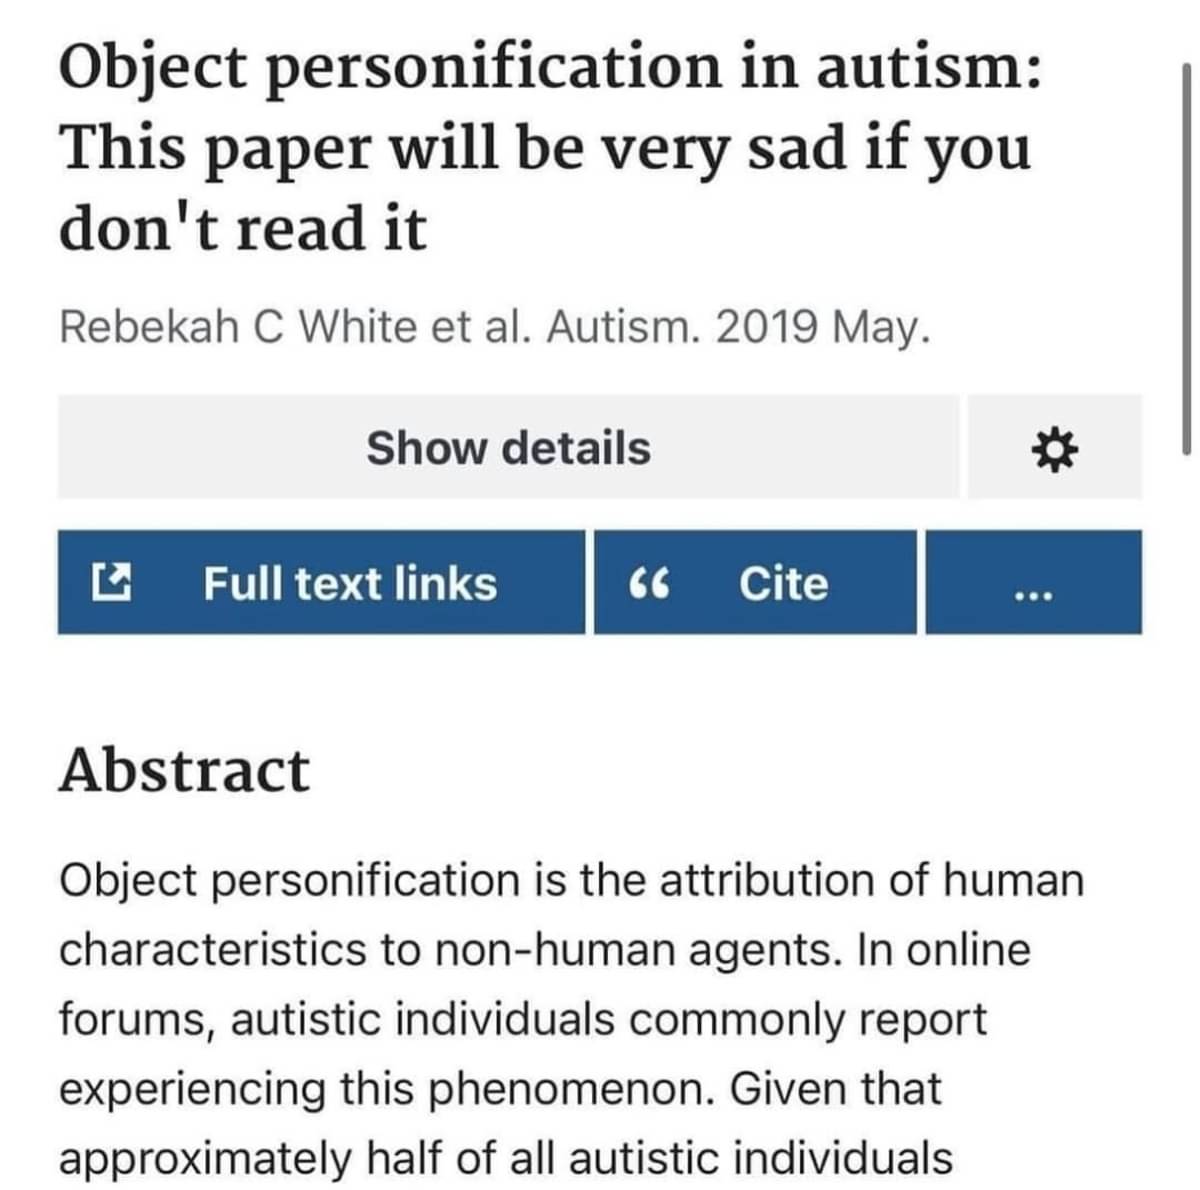
I think you are misreading this. The age sections at the top are just a demographic breakdown of the two groups. Note rhat all the different percentages for age sum to 100. The results are just the bottom section of your screenshot (“anthromorphic questionnaire”). Does seem to be statistically significant.
I’m pretty sure the age and gender in that table is just showing the frequency of the ages in the sample, not a crosstab of age or gender with personification/anthropomorphism.
So that’s saying their autistic population skewed younger than their non-autistic population. Which isn’t unsurprising, it’s a lot easier to get a diagnosis as a child, and generally easier to get diagnosed now compared to a few decades ago. So people over 35 or so are going to just be less likely to have had the opportunity for diagnosis. The authors do address differences in gender representation between the samples but I don’t see age addressed specifically. It could just be that younger people tend to personify/anthropomorphize more, so since the sample of people with autism skewed pretty heavily towards the 16-24 group the results could instead be displaying differences by age. I don’t think they quite have the sample size to delve into age too much. I think they’d only be able to get away with doing two groups at 34 & under and 35+. That would be a good start though.
This is also a heavily self-selected population, apparently largely from social media. I’m always automatically skeptical of social media sampling.
I would’ve liked to see a little more detail about exactly which tests and assumptions they were using. The gender difference looks like they did a t-test, but it’s left to the reader to assume they ran a two-tailed t-test. They could easily have bolstered their numbers by reporting the one-tailed test.


I hope i don’t make the paper sad by saying this but the numbers are kinda off. (Or i misunderstand)
The only real difference is for below age 24. Then its pretty much the same if not less prevalent for autists.
They point to some other factors about the types of questions that indicate that the differences are underestimated but evidently that didn’t translate in hard numbers.
I think you are misreading this. The age sections at the top are just a demographic breakdown of the two groups. Note rhat all the different percentages for age sum to 100. The results are just the bottom section of your screenshot (“anthromorphic questionnaire”). Does seem to be statistically significant.
The actual results are in the text. 56% personifiers among autists vs 33% among not autists, p<0.05. Self report is p=0.06.
I’m pretty sure the age and gender in that table is just showing the frequency of the ages in the sample, not a crosstab of age or gender with personification/anthropomorphism.
So that’s saying their autistic population skewed younger than their non-autistic population. Which isn’t unsurprising, it’s a lot easier to get a diagnosis as a child, and generally easier to get diagnosed now compared to a few decades ago. So people over 35 or so are going to just be less likely to have had the opportunity for diagnosis. The authors do address differences in gender representation between the samples but I don’t see age addressed specifically. It could just be that younger people tend to personify/anthropomorphize more, so since the sample of people with autism skewed pretty heavily towards the 16-24 group the results could instead be displaying differences by age. I don’t think they quite have the sample size to delve into age too much. I think they’d only be able to get away with doing two groups at 34 & under and 35+. That would be a good start though.
This is also a heavily self-selected population, apparently largely from social media. I’m always automatically skeptical of social media sampling.
I would’ve liked to see a little more detail about exactly which tests and assumptions they were using. The gender difference looks like they did a t-test, but it’s left to the reader to assume they ran a two-tailed t-test. They could easily have bolstered their numbers by reporting the one-tailed test.
By 24 we learn that people find it weird and stop doing it
We stop doing it publicly, at home we’re always complimenting our inanimate friends.
As doctor whatshisorherface said, the first percentage is just showing participant age group, as both lists add up to 100%.